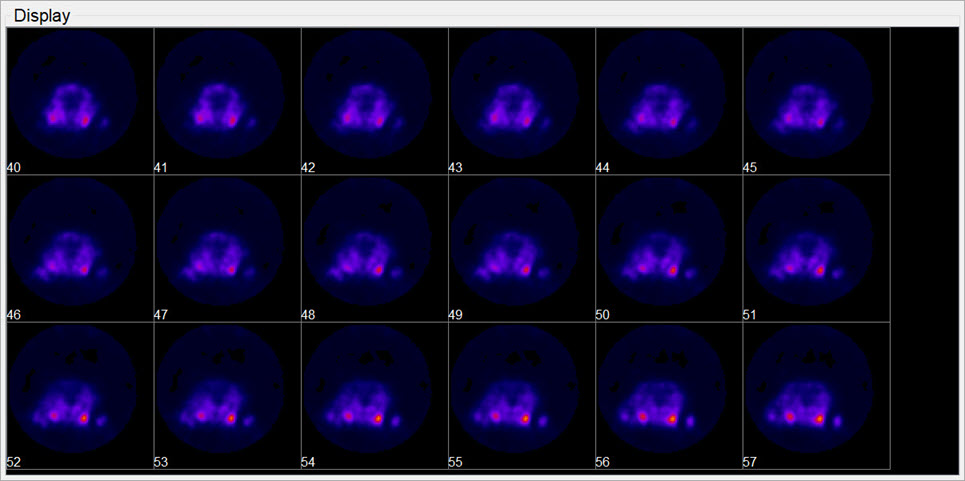
The Tile View displays an array of slices for either sagittal, coronal, or transversal view of the loaded data sets. The number of slices displayed depends on the size of the VivoQuant window.
Getting There
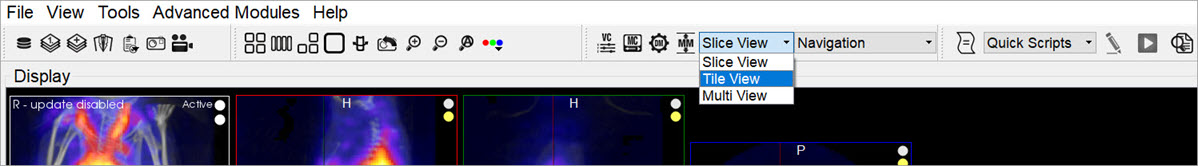
The Tile View is available via a pull-down menu on the Main Window.
Using the Tile View Display
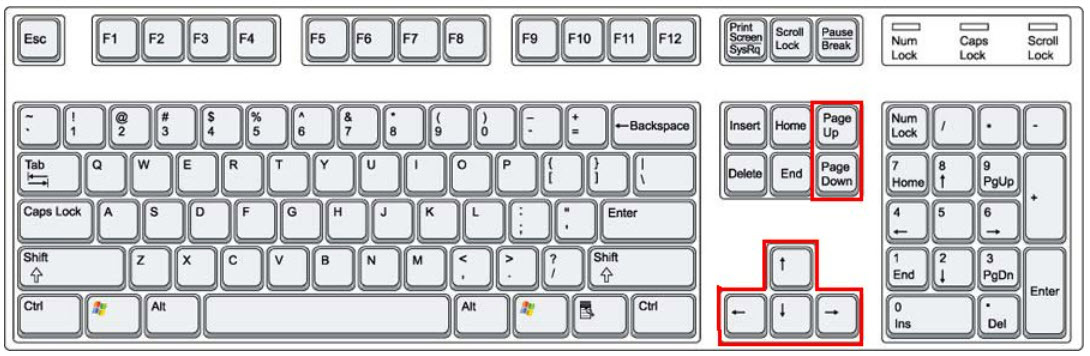
You can scroll through slices in the Tile View using the scroll wheel on a mouse or using the arrow and paging keys on your keyboard. The keys control the rate at which the user scroll through the tiles.
Shortcuts
The following table displays the function of the arrow and paging keys for each active view. It also contains key and mouse sequences that allow users to pan and zoom within a slice display frame.
It is important to note that this zoom behavior differs from the standard Zoom. This zoom keeps the displayed slice bounds fixed and performs the zoom and pan within these bounds. In contrast, other UI zoom controls change the scale and display bounds of the slice.
Slice / Tile / Multi View - Navigation
| Windows / Linux Key | Mac Shortcut | Description |
|---|---|---|
| ←,→,↑,↓ | ←,→,↑,↓ | Scroll through slices |
| PageUp,PageDn | fn + ↑, fn + ↓ | Scroll through slices |
Slice / Tile / Multi View - Intraframe Zoom And Pan
| Windows / Linux Key | Mac Shortcut | Mouse Button and Action | Context | Description |
|---|---|---|---|---|
| Shift | Shift | Left down and drag | Cursor over slice frame | Translates (pan) |
| Shift | Shift | Midel down and drag | Cursor over slice frame | Translates (pan) |
| Shift | Shift | Scroll wheel | Cursor over slice frame | Zooms within display bounds |
| Ctrl + R | ⌘ + R | Cursor over slice frame | Resets zoom and pan |
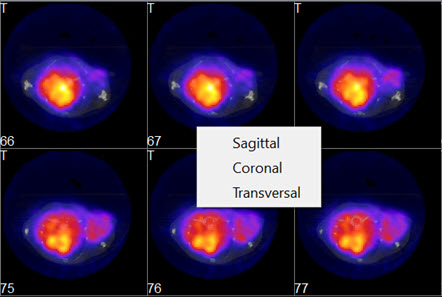
To switch between views (coronal, sagittal, transversal) in the Tile View, right-click on a tile and choose the desired view.
There are two operators available in Tile View. The Time Series operator, which enables dynamic data to be viewed as a time series, and the 3D ROI operator operator, which enables ROIs to be displayed in Tile View.