Use the using VivoQuant’s Dosimetry Calc tool, in conjunction with the third party application OLINDA (Organ Level INternal Dose Assessment), to estimate whole body dosimetry data. The Dosimetry Calc tool calculates the cumulative activity per unit activity administered (units in uCi-hr/uCi) which is the required input to the OLINDA application for dosimetry calculations.
The cumulative activity per unit activity administered is estimated using the following area under the curve (AUC) method. The tool uses a curve fitting algorithm which fits the experimental isotope’s exponential decay curve to the percent injected dose per gram (% ID/g) vs time curve of the experimental data. The AUC is calculated using trapezoidal approximations for experimental measurements, and the remaining AUC is calculated using the analytical solution to the definite integral.
The data is then stored in a .CSV file that can be copied into the OLINDA application.
Getting There
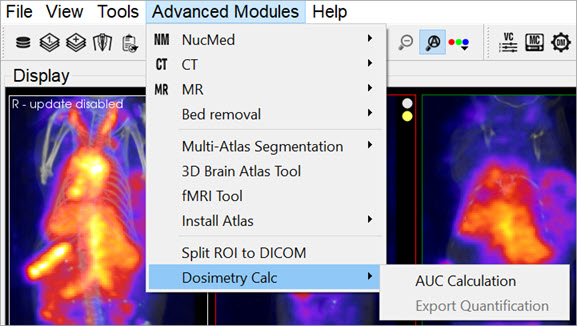
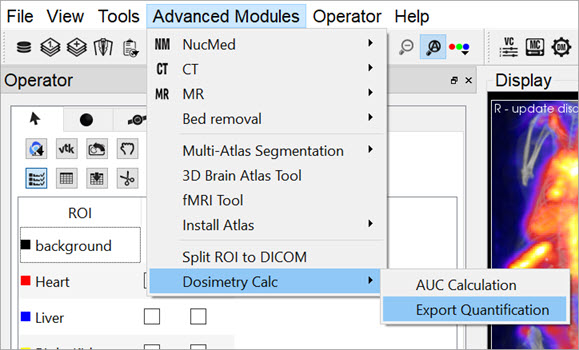
To access the Dosimetry Calc tool, the 3D ROI Tool must be active. Go to the Advanced Modules tab, then move down to Dosimetry Calc.
Function
Getting Started
Start the tool by selecting Export Quantification.
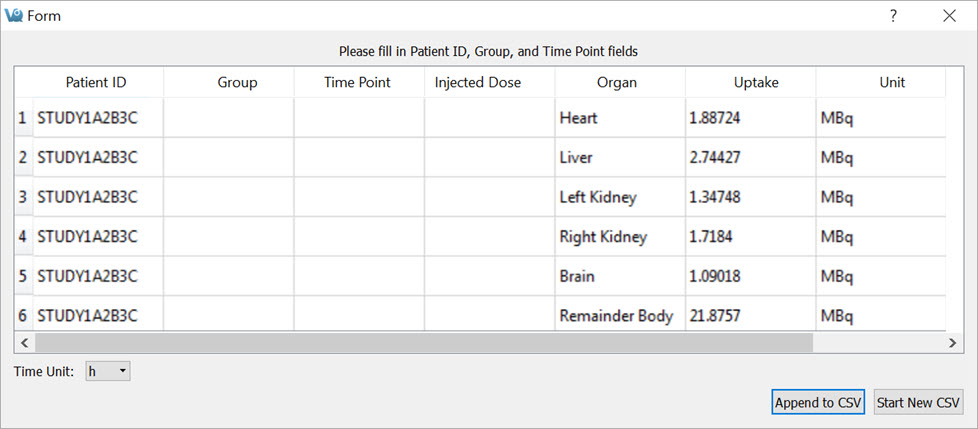
Once the tool starts, a spreadsheet appears and requests you to fill in missing information from the study. You can do this either in VivoQuant or in another spreadsheet software.
| Column | Info |
|---|---|
| Group | Group number. This allows for multiple groups to be used at once. |
| Time Point | Time point of the study for each frame. The time units can be manipulated using the drop down menu on the bottom left of the window or manually in another spreadsheet software. |
| Injected Dose | Initial injected dose. |
Once the spreadsheet is complete, save the information as an easily accessible .CSV file. In VivoQuant you may append an existing .CSV file or start a new one.
Using the AUC Calculation
Go to Advanced Modules, then select Dosimetry Calc > AUC Calculation.
Click Load Spreadsheet in the top left corner of the dialog box, and call the spreadsheet you created in the last section. In the Dosimetry Isotope drop down menu, select the isotope that was used in the experiment. If the isotope used is not listed, open the file isotopes.txt located in the VivoQuant install directory (default is C:\Program Files\inviCRO\VivoQuant) and add the isotope information.
Ensure that you select the correct isotope, because the Dosimetry Calc tool uses a curve fit algorithm and extrapolates using only isotope-specific radioactive decay information.
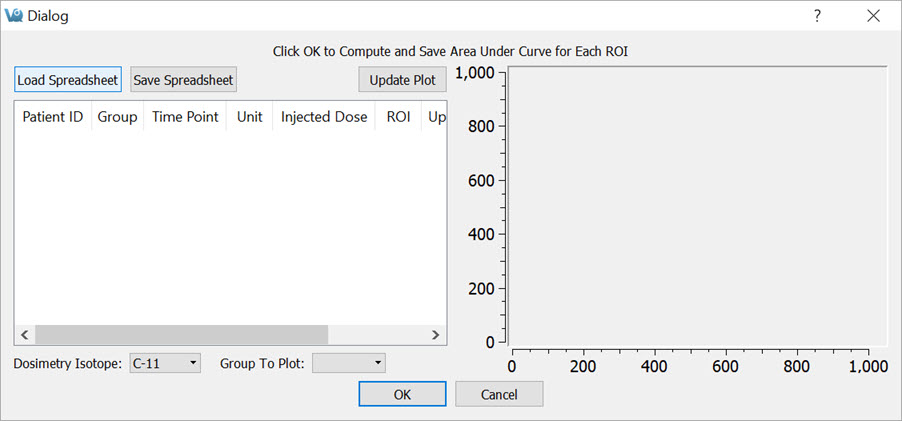
Next, click Update Plot and enter the initial percent injected doses assumed for each of the ROIs.
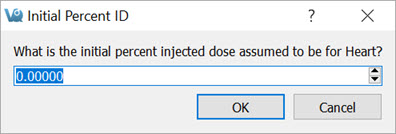
The Plot should now appear next to the table in the window.

Click OK and save as another .CSV file. This data is now ready to be used in the OLINDA software.